Friday, January 28, 2011

EBT (food stamps) and Fast Food: Implications for Market Demand


At some point in 2010 I started noticing different fast food restaurants in California, both in the SF Bay Area and Los Angeles County offering to accept payment via EBT (Electronic Benefits Transfer for food stamps programs). This is a change from the prior rules wherein EBT could only be used for unprepared food e.g. from the grocery store. Now under different programs such as Los Angeles County's Restaurant Meals Program, it is now possible to use food stamps to get fast food, e.g. pizza from Pizza Hut. Before I get into the possible positive and negative effects of this change in policy I want to explain the effects of this change on the market equilibrium for fast food.
In short, this change in policy creates a kink in the demand curve for fast food, as low income EBT recipient customers increase their demand, while demand by higher income customers does not change.
Consider two fast food buying customers. Person A earns an income that disqualifies him from EBT. Person B earns a low enough income to qualify for EBT, and has chosen to receive those benefits.
Here is person A's demand curve:

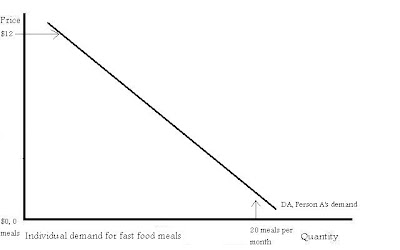
You can see that if fast food was practically free, Person A would consume 20 meals per month. Also notice how, because he has the budgetary capacity, at a price of $12 per fast food meal, Person A would still buy a small quantity of fast food per month at this high price.
Now consider Person B's more modestly budgeted demand curve. This is person B's demand for fast food meals before the change in policy that allows him to purchase fast food with EBT.

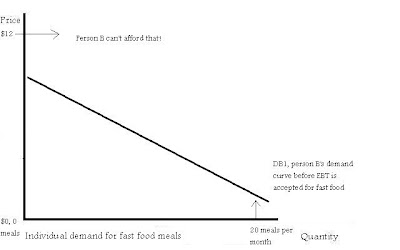
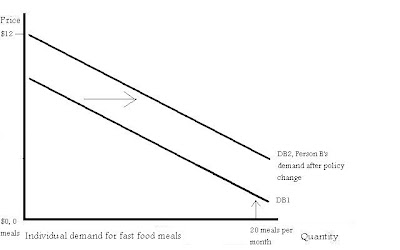
Notice how at a price of $12 per meal Person B will not buy any fast food meals. This is beyond his budget at this point. So what happens to Person B's demand curve when suddenly he can use EBT to purchase these meals? This change in policy will shift his demand curve for fast food to the right, because he will now be more able to purchase fast food meals at various prices. Here's his new demand curve:


We have now seen the effects of this change in policy on two individuals, one on food stamps and one not. But what about the market demand curve? And what does this mean for market equilibrium (the point where the quantity demanded equals the quantity supplied)? Let's find out. Because the market demand curve is the summation of all the individual demand curves, just imagine adding together all the demand curves for all the Person A-s and Person B-s of the market. Let's say the demand and supply curves before the policy change look like this:
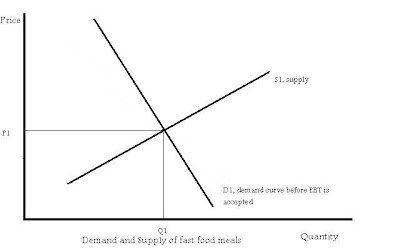
The market price is at P1 and the quantity sold is at Q1. Suddenly the county government for this market allows EBT to be used to buy fast food. What would this do to the demand curve? Because higher income, non-food-stamp recipient customers like person A can affect the entire market demand curve, from the highest prices to the lowest, and lower income food-stamp recipient customers like person B would tend to only affect the lower parts of the demand curve, when EBT is suddenly allowed for fast food purchases, it is only the lower parts of the demand curve that will shift outward (in reality the change would probably not be this prominent but I have made it prominent just for demonstration). Here is the new market demand curve:
The result is a kink in the demand curve pushing out at the point where most food stamp recipients would be priced out of the market. Assuming the supply curve is below that point, this increases the equilibrium price to P2 and the equilibrium quantity to Q2. Thus this policy is a good thing for fast food companies, increasing their revenue by the amount of:
(P2*Q2)-(P1*Q1)
So what is the significance of the kink in the demand curve? Probably nothing in today's market, because fast food prices usually stay so much in the lower level that the portions of the demand curve higher than the kink will not come into play. In effect the shift is probably more like a shift of the entire demand curve, because the upper reaches may not even matter for equilibrium. However, if there were suddenly massive supply shocks in the inputs for the supply of fast food, e.g. global potato crop failure, the price might go high enough that more and more Person B-s actually get priced out. Let's hope that doesn't happen anytime soon. Nonetheless it's interesting and worth noting that (at least according to my reasoning) the whole demand curve does not shift, just the lower portion.
Now that I've looked at my graphs, what do I think of this policy?
I'm conflicted on this issue. Fast food is usually bad for you (except for the notable example of Subway). Nonetheless, a food stamp recipient can find food that is just as bad at the local grocery store. There is nothing in the law to prevent a food stamp recipient from using EBT to eat nothing but sticks of butter and Captain Crunch cereal. Also, for homeless food stamp recipients, lacking kitchen tools, buying prepared food can be the easiest way to get a hot meal. The issue here is how paternalistic does one want their government's social welfare programs to be? There is no demand and supply diagram that can easily find the best answer to this question. From my political preference, I am more on the side of allowing EBT purchases of prepared food. Not all of the poor will give themselves heart disease because of this policy change. Some will. But really this is a seperate issue. More nutritional education, (Public Service Announcements etc.) is the key to getting people to demand less junk food in the first place. Thus the "invisible hand" would force fast food companies to offer better choices. Ever since the movie "Super Size Me", I think we've already seen this happening.
I honestly don't know what the best policy is in this case. All I can say is, from just looking at the demand and supply curves, this is a great policy for fast food companies' profit margins. It is also bad for the profit margins of grocery stores who no longer have a monopoly on EBT food transactions.

Monday, January 24, 2011

How Not to Package Your Product


What's wrong with this picture?

Okay, I admit it. This article is not my best example of hard hitting in-depth economic analysis. Its more an excuse for me to post a funny picture I took at a Walgreens today, (kind of like my last article about that bizarre viral billboard campaign). However, I will say that this picture, taken from the package of a bargain plug-in video game console, is a great example of how not to package a product. Just one more quality-control step could have prevented this confusing and humorous design choice. Sometimes all it takes is a second pair of eyes to notice something like this.

Or perhaps this wasn't a mistake. In the rush to bring this bargain product to market, the packaging team might not have had time to take (or photoshop) a picture of a kid playing the game plugged into a backseat television screen, and whoever gave the go-ahead on the package design just said "eh, that's good enough." Whatever the case, the result is a barrel of laughs!

But I'll take this a step further. I think this kind of mistake is emblematic of the "death of the proofreader" a phenomenon brought about by the advent of spelling and grammar checking software. I am not an anti-spellcheck luddite, but it's just a matter of fact that before spellcheck and grammarcheck, a second pair of eyes was a necessary part of copy writing for packaging and other media. But that second pair of eyes can be expensive, and for many tasks, digital checking can be superior. However, problems arise because computers cannot easily deal with the meanings behind words. For example, to a spelling and grammar checker the sentences "They had a fight" and a corresponding typo "They had a fig" are equally valid. It would take a proofreader to recognize that error, just as it would take a proofreader to recognize that the kid in the second picture is playing his game on a tv stand, which is rather hard to do in a car.

(I sure hope there are no typoes in this article.)

Thursday, January 13, 2011

Weirdest Billboard Ever?


I was driving in West Los Angeles today when I came across a billboard so strange I could hardly believe my eyes. From a distance I could see the words "Win a Free Booby Prize", next to an image of a voluptuous woman. At first I thought this was some kind of off-color strip club or plastic surgery advertisement. Boy was I shocked when I drove closer and saw that that the woman on the billboard had a blurred Jesus face!!!!!
So, why does this belong on an economics blog? It does because this is a great example of today's trend towards "viral" marketing. The makers of this billboard, whether they are plastic surgeons or eccentric Christian missionaries, are counting on people like me being so baffled by this ad campaign that they will go to "freeboobyprize.com" to find out what the heck is going on. And by posting this picture and writing about this I am playing right into their hands. But I can't resist. It is too bizarre to ignore.
This may turn out to be a success for whatever organization put this billboard up. I'm certainly curious. And if it is a success, there may be imitators with even more shocking and baffling billboards. But to return to a theme I've been talking about a lot lately, this type of bizarro billboard campaign would probably only be successful a few times. Imitators would face diminishing returns as the novelty of such ad campaigns wore off among the public.
So what is Free Booby Prize? I'm curious, but perhaps not curious enough to go to their website, because then I would officially be a sucker to this billboard.

Sunday, January 2, 2011

How Did My "Saw 3D" Prediction Hold Up?


A few months ago, I wrote an article using regression analysis, (let me rephrase, simple and not-so-scientific regression analysis) to predict the box office results of the seventh Saw movie, "Saw 3D". The quantitative model predicted a gross of $17,047,984 in line with the diminishing returns witnessed with each of the last five sequels. But I disregarded this figure in favor of a vague prediction that the film would be much more successful than that, due to its being released in 3D. As it turns out, my vague and non-commital prediction came true. Saw 3D grossed $45,710,178, which was about 20 million dollars more than its non-3D predecessor, and much more than the model predicted. This movie bucked the trend of diminishing marginal returns for sequels and the introduction of 3D into the franchise is probably the reason.
So does this mean that new Saw movies will be successful as long as they are released in 3D? No. 3D film itself will probably succumb to diminishing marginal returns soon, and by the time halloween rolls around this year, experience may have shown that the 3D fad is as dead as John the Jigsaw Killer. In which case it may be more profitable to take this franchise straight to DVD.

Wednesday, November 10, 2010

A Strategy Guide for my Economics-Based Video Game


Recently I have gotten really interested in computer programming. Right now I am learning the Java programming language, and have used it to create a simple text based game called Cake Wiz. You may ask, "What does this have to do with economics?" Actually it has quite a lot to do with economics. The game I created is a business simulation game, where the player runs a bakery. I've written this article to explain the economic principles behind the game. Before I give too much away, you might want to play the game first. You can access it here:


(And here's a screenshot. On the page, press the "click here" button to start your game. I wasn't clear about that.)


(Special thanks to good friends Steve and Bennique Blasini for letting me use a page of their business' website for my silly game. They are brilliant special effects artists and if there are any hollywood producers out there reading this: hire BFX Image Works if you ever need some computer graphics done for a film.)

In my game, the player makes four decisions every business day at the bakery:
1. how much cake mix to buy, based on a price that fluctuates.
2. how many cakes to bake from the mix, keeping in mind that cakes expire after two days but cake mix does not expire.
3. how much to spend on advertising
4. what price to sell the cakes for
Without giving away all the secrets how the game works, I will say that the number of cakes you can sell every day is based on four very important concepts in business and economics:

1. The price elasticity of demand. This is a measure of the change in the quantity demanded in response to a change in price. Except in rare cases of "snob appeal", people will demand less of a good if its price is higher. So in the game, if you start selling your cakes for a higher price, not only can the quantity sold fall, but your total revenue might fall if the price increase does not offset the quantity drop. You also might lose unsold cakes to spoilage.
2. Diminishing marginal returns. In this case, I'm referring to diminishing marginal returns of dollars spent on advertising. This basically means that you can spend too much on advertising. At a certain level of spending, every extra dollar spent on advertising may not have as powerful an effect as the dollars spent before it. To explain, imagine that one out of every 20 commercials on TV was for the "Shake Weight." This would probably greatly increase sales of the Shake Weight over not advertising at all. But if 20 out of 20 commercials on TV were for the Shake Weight, what effect would this have? TV viewers would probably say "I get it already!!! Enough with the Shake Weight!!", and the effect of the extra 19 commercials would undoubtably not be worth the extra cost. So keep this in mind when choosing your level of advertising spending in the game.
3. Inventory Management. In my game, and in business in general, you don't want to accumulate a lot of inventory that will go to waste, especially since goods like cakes expire with time. But on the other hand, you don't want to run out of inventory, which will cause you to miss out on extra sales, and possibly lose disappointed customers for good.
4. Randomness. In my game, as in business, you may find there's an unexplained, random element to your circumstances. You should change your behavior to hedge against the effects random fluctuations in demand or the cost of productive inputs.

So basically, the key to doing well at my game is using trial and error to find the right pricing, advertising level and inventory level to make a good profit in the face of randomness.
Hope I didn't give too much away and that you enjoy my game as much as I enjoyed programming it.

Wednesday, November 3, 2010

The Economics of Frontal-Bus-Squishage


Have you ever gotten onto a city bus and immediately been stuck in a huge cluster of people at the front of the bus, when there is plenty of space, and maybe even seats in the back? I have often struggled with this curious phenomenon, and my inner economist seeks a reason for, and maybe a solution to this problem. I have come to the conclusion that the problem of front-of-bus squishage can be easily understood through an examination of the unique costs and benefits that riders face in different parts of the bus.

When people think of prices, they often think only of money given in exchange for something else of value. But everything of value has a price, often not paid in money, but with other assets, such as personal space, comfort or dignity. Personal space is the asset that bus riders often give up when they are crammed together in the front of the bus, even when there are unused assets towards the back that could make everyone’s ride more pleasant.
Why do these assets go unused? After careful consideration, I've realized that bus blockage situations happen because of two things:
1. The bus riders who would most benefit from the extra space on the bus are those who would face the most costs in acquiring it. And,
2. Bus riders who would face the least costs in acquiring more space on the bus are those who would least benefit from more space.
To put this more simply, those who can more easily access the extra space have less need for it. Thus the extra space in the back goes unused.
Allow me to explain.
Envision an empty bus. As riders get on the bus, they immediately take the seats. Once all of the seats are taken, riders have no choice but to stand. In the absence of external forces, people will tend to want to stay put. In more common usage this can be categorized as "laziness". Because of this law of behavioral inertia, riders who come onto a bus with no available seats, rather than moving immediately to the back to clear space for new riders, will tend to stand in the front, relatively close to where they got on. There is, when entering a non-crowded bus with no available seats, no direct and universal incentive for bus riders to move further back, and because of this, as more riders get on the bus, clusters of frontal-bus-squishage form. And because of the different costs and benefits facing bus riders at different parts of the bus, once they form, these clusters are hard to break up. To help explain, take a look at this diagram I have artfully put together:


The diagram singles out two bus riders, person A and person B. Person A is stuck in the middle of a cluster of people (zone A), while person B is at the edge of the cluster, (in the spacious zone B). In this formation, Person A would greatly benefit from the extra space at the back of the bus, but would face the costs of squishing past three people in order to get there.
If you think the word "cost" is inappropriate to describe what person A faces here, ask yourself: do you enjoy squishing past people in thick crowds? Probably not, both for your sake, and out of a polite desire not to squish others. Thus you would face a cost in getting from zone A to zone B. The unpleasant squishing would be the price you’d pay for more space.

So person A, in order to benefit himself, and indirectly the people around him (in econ-speak, a positive externality), would pay a relatively high price for moving to zone B. Person A would need to press up against other riders, and awkwardly slide and slither through. This is a cost, as real to person A as the cost of a loaf of bread. Person B however, who is already at the edge of zone B, has plenty of space in front of him. And for the relatively low cost of simply moving his feet for a few steps, Person B could move further into zone B, and thus help lighten the blockage for everyone in zone A. But because person B is not being squished from both sides like everyone in zone A, he won't personally benefit much from moving towards the back. Person B's needs for space have largely been satisfied.
In the act of moving towards the back, Person A and other riders like him, face high costs and high benefits, while Person B and other riders like him face low costs and low benefits.
And there we have it. A cluster of front-of-bus-squishage. The cluster will break only if:
1. person B and/or others like him realize that they need to move back, or
2. if a few brave (or rude?) souls in Zone A decide it is better to squish past everyone to get to zone B, than to remain in the cluster. This is an altogether less pleasant solution than in 1, which involves no extra squishage.

So far there is only one tool in use that I know of for preventing or resolving the frontal bus squishage problem: Shame. The bus driver needs to shame the "person B"s of the world into moving back, usually by yelling "move back, everybody". (Even more effective is "I'm not moving this bus until you move to the back!") But maybe an automated system would be more effective. If money were no object, engineers could design a bus that uses sensors to detect clusters of frontal bus squishage. Upon detection, a polite yet insistant robot voice could ask the "person B"s to "please move back" over and over until the situation was resolved. If need be, it could also give them mild electric shocks until they do. Here is a diagram of how that would work:

(I sure hope anyone reading this has a sense of irony. For the record, I am not a psycho.)

But what about carrots rather than sticks? Adding extra benefits in exchange for moving to the back could work just as well, or even better than shame or electrocution. How about a free snack dispenser, or a gentle foot-massaging floor that activates in the back when the sensors detect a squishage?
All kidding aside, to solve this problem, the costs and benefits must be realligned, either by making it more costly to create a blockage, or more beneficial to prevent one. In econ-speak this would "internalize the externality." Snacks, electric shocks, or massages could theoretically all be used. But in reality, it seems we can only rely upon the shame that a good and forceful bus-driver can inflict on Person B. That, and hopefully, bus riders' courtesy to their fellow passengers will help too.

Saturday, August 14, 2010

The Econ Geek's Guide to Deal or No Deal: an Empirical Study

The game show "Deal or No Deal" is an econ geek's dream. Not only is it a thrilling spectacle for game show lovers, it is also a laboratory for studying human risk-taking behavior. For those who don't know the rules, on the show there are 26 numbered briefcases, each with a tag inside, showing an amount of money. The amount of money in each case ranges from 1 penny to 1 million dollars. The contestant first chooses one of the cases to take into possession, and then through the rest of the game, eliminates cases from the remaining 25, starting with 6 cases at once, then 5 then 4 then 3 then 2 then 1 at a time until all but the contestant's case is gone. As each case is eliminated, the amount it contains is exposed, thus letting the contestant know what amount is not in her own case. If the contestant eliminates all of the 25 cases, she walks away with the amount of money in the initially chosen case. The twist is that there is a "banker" on the show who after each round of elimination, offers the contestant an amount of money to stop playing. Because, superstitions aside, the choice of eliminating one numbered case over another does not matter, the only pertinent decision in the game is whether to take the deal or keep playing, (which makes the title of the show particularly fitting).
As the contestant continues to eliminate from the 25 cases, by inference, she gets a better idea of what is in her own case, and so does the banker. So if the contestant eliminates the case that has the penny, that's a good thing, because it means that the personal case doesn't contain the penny. If the contestant eliminates the million dollars, she knows that her personal case doesn't contain the million, and this is a bad thing.
For years I have watched this show, and wondered "how does the banker choose the amounts of each offer?" After quantitatively studying this (albeit with a limited sample of 64 offers from 9 complete games) I think I have come close to answering this question.
To understand how the banker makes his offers, there's one key mathematical concept to keep in mind: expected value. Expected value is equal to the sum of the values of all possible outcomes multiplied by their respective probabilities. It is the average amount of money per person that a large group of people would win on this game if they never took deals.
When one starts the game, the dollar values of the cases are as follows:
$0.01, $1, $5, $10, $25, $50, $75, $100, $200, $300, $400, $500, $750, $1000, $5000, $10000, $25000, $50000, $75000, $100000, $200000, $300000, $400000, $500000, $750000, $1000000
And the probabilities of each outcome are equally likely: 1/26= (approximately) 0.03846.
So, the expected value, (in this case also just the average of all values because the probabilities are the same), is equal to:

$0.01/26 + $1/26 + $5/26 + $10/26 + $25/26 + $50/26 + $75/26 + $100/26 + $200/26, +$300/26 + $400/26 + $500/26 + $750/26 + $1000/26 + $5000/26 + $10000/26 + $25000/26 + $50000/26 + $75000/26 + $100000/26 + $200000/26 + $300000/26 + $400000/26 + $500000/26 + $750000/26 + $1000000/26 = $131,477
So, when you start the game, the expected value of your personal case, before any of the remaining cases are eliminated, is $131,477. What if, before you even started playing, the banker offered you $80,000 to not play the game at all? Would you take the deal? On average, taking this deal would get contestants much less than playing through all the way. But for reasons I shall explain later in this article, the banker usually makes offers that, just like this one, are significantly lower than the expected value of the case, and despite the low offers, very few contestants actually play through all the cases.
As one plays the game, and eliminates cases, the expected value of what's in one's personal case changes. Lets say that the contestant has eliminated 24 of the cases, leaving just the personal case and one other case in play, and that the only two possible values remaining are $0.01 and $1,000,000. Because the probability of either outcome is 1/2, the expected value of the contestant's personal case would be equal to:
$0.01/2 + $1,000,000/2 = $500,000
What if at this point in the game, the banker offers a deal for $250,000? Ask yourself: if you had a choice here between choosing your case, which might have a million dollars in it or might have a penny, or taking a deal for $250,000, what would you do?
Personally I would take the $250,000. This illustrates an important concept in economics: risk aversion. I am risk averse in this situation because I would choose a certain reward over an uncertain one, even if the expected value of the reward in the uncertain event is greater than the certain reward.
So in Deal or no Deal, the banker always wants the contestant to take the deal, right? Wrong. If contestants took the first or second deals there wouldn't be much of a show, and the network would need to bring on more contestants, and thus give away more prizes, to fill airtime. On top of this, the show tends to get more interesting as it goes along and people make the riskier decisions. For these two reasons, one related to the costs of broadcasting the show, and the other related to the benefits of having a more interesting show, there is an incentive to make lower offers to the contestants in early rounds to get them to play for longer.
The quality of an offer can actually be quantified. There's a measurement I use to find the quality of a deal relative to what cases are still in play. I call it the "Offer Quality Ratio", and here it is:
offer quality ratio = (offer amount)/(expected value of remaining cases at time of offer)

So lets say there are the following cases left on the board (by the way, this is from an actual episode): $1, $100, $50000, and $100000
and the contestant gets an offer of $27000.
The expected value is = $1/4 + $100/4 + $50000/4 +$100000/4 = $37525.25
So the Offer Quality Ratio = $27000/$37525.25 = 0.7195
In other words, the offer is around 72% of the expected value of playing to the end.

After the challenging task of watching TV for hours, I have collected data on 64 offers from 9 complete Deal or No Deal games. My results show that as contestants play the game, they tend to get rewarded with higher quality deals relative to what cases are still in play. From these 9 games, here are the average Offer Quality Ratios for offers in each round:

First offer: 28.9% of expected value, (Standard Deviation 15.8%)
Second offer: 42.8% of expected value, (Standard Deviation 15.0%)
Third offer: 47.7% of expected value, (Standard Deviation 13.6%)
Fourth offer: 54.8% of expected value, (Standard Deviation 12.2%)
Fifth offer: 65.1% of expected value, (Standard Deviation 17.8%)
Sixth offer: 65.0% of expected value, (Standard Deviation 16.1%)
Seventh offer: 84.0% of expected value, (Standard Deviation 17.3%)
Eighth offer: 90.6% of expected value, (Standard Deviation 18.3%)
Ninth offer: 97.6% of expected value (S. Dev 3% from a limited sample of just two offers)

Though I'm sure this study would benefit from a larger sample size, there are two conclusions I have drawn from it.
First, the quality of deals relative to what is on the board tends to rise as games progress. As you can see, the first offer tends to be incredibly low, and is usually not even worth considering.
Only the most risk averse contestants would take a first offer that's under 30% of expected value. As the game progresses, the managers of the show, weighing the costs of giving a bigger payout against the benefits of a more interesting show and more airtime per contestant, increase the quality of the offers.
Secondly, the standard deviation (the average amount of sample variation above or below the average value of all elements in the sample) of offers is significant, at around 15 to 20 Offer Quality percentage points, and remains rather constant throughout the game. This is either because there is an element of randomness built into the offer-determining formula used on the show, or there are hidden variables determining part of each offer. Maybe contestants are given a psych evaluation before the show that gives insight into their risk profiles? This would help the banker minimize payouts while maximizing the thrill of the show.

So, the moral of the story is, if you are ever on Deal or no Deal, fortune might favor you because of your boldness. Rather, I should say, the "banker" (and by that I mean the managers and producers of the show) might favor you with a good offer because you've made the show more interesting, and thus more profitable.

Sunday, August 8, 2010

Why Soccer is Less Popular in the U.S.

What is it about soccer that has stopped it from really taking off as a spectator sport in the United States? Could it be the low goal scoring? The constant change of possession? In my opinion, the answer has less to do with the aesthetics of the game than it does with economics (big surprise, right?). Allow me to explain.
To understand the market for televised soccer, one must first understand the economic quirks of the television market in general. Specifically, antenna television has the problem of being what economists call a "public good." A public good has two characteristics:
1) It is non-rivalrous in consumption, meaning one person's consumption of the good does not prevent others from using it. While goods like apples are rivalrous in consumption, meaning if you eat an apple, someone else cannot also eat that apple, one person's watching a television program does not stop anyone else from watching it on a separate TV.
2) It is non-exclusive in consumption, meaning nobody can be stopped from consuming the good if they want to consume it, making it impossible to collect money in exchange for consumption. While a grocery store can prevent the theft of its apples, a TV network broadcasting over airwaves cannot prevent anyone with a television from harnessing those airwaves to watch TV programs.

Cable and satellite broadcasts, however are excludable. These advancements have bypassed the problem of money collection for TV services. But things were different before the age of cable TV. In these early decades, there were two choices for financing television, either publicly funding it, or getting revenues from advertisers. The United States, unlike many other countries in the world, has relied primarily upon a private system of television funding, based on advertising. In the US, the advertiser became the real customer, paying for airtime, and the TV viewer was a bystander to the process. The commercial break became a necessity. In other countries however, governments stepped in to create networks like the BBC in Britain, that were funded by taxation, thus eliminating the need for commercial breaks.

But what does this have to do with soccer? Quite a lot really. The game of soccer is divided into two continuous 45 minute halves. Other than half-time there are no natural breaks in the game, like time-outs in American football or basketball, or breaks between 9 different innings as there are in baseball. This is a problem for broadcasters who depend on commercial breaks for their only source of revenue. For this reason, in an advertising based financing system, soccer games will tend to be chosen less than other programs. Why show a soccer game with only a few commercial breaks during half-time, when you can show a basketball game with numerous time-outs, breaks between quarters, and a half-time break? So antenna-televised soccer is not just a public good, but a public good that is resistant to advertising.
To explain why soccer is not so popular in the United States, my theory is, in recent decades when soccer became the world's most popular sport, its lack of exposure on US television played a role in its relative lack of popularity. Soccer haters may disagree, but the economic logic is sound. The pay-for cable and satellite sports networks that sprang up in the age of cable, or new forms of web based broadcasting, may eventually give soccer the exposure it needs to be on par with football, baseball and basketball. Just don't expect any of the traditional networks to broadcast a soccer game when there's a perfectly good basketball game to show.

Saturday, July 24, 2010

More Econometric Fun With The Saw Movies (This Blog Article is in 3D)


Last year, I attempted to predict the box office success of Saw 6 using regression analysis aided by statistical software. Since the gruesome Halloween tradition of the Saw franchise will continue this year with "Saw 7: 3D" I'm going to try it again and see if I can improve on my powers of prognostication.
To help the non-econometrically inclined understand what's going on, here's the same basic explanation of regression analysis I included on my James Bond article:
For those unfamiliar with regression analysis, it's a statistical method that searches for correlation among phenomena. It uses calculus to find the mathematical equation that best fits a group of numerical data. This type of math is really labor intensive, and for large data sets was near impossible before the computer age. I don't know how the calculus works, but that's OK for my purposes. I just think of statistical software as a "magic box" that spits out predictive functions when I put numbers into it.
This is the method I shall use to try to predict how much money Saw 7 will make at the domestic box office.
So let's get started. Here is the data of how much money each Saw film has made:

Saw 1 - $55,185,045 (2004)
Saw 2 - $87, 039,965 (2005)
Saw 3 - $80,238,724 (2006)
Saw 4 - $63,300,095 (2007)
Saw 5 - $56,746,769 (2008)
Saw 6 - $27,693,292 (2009)

To improve the analysis, as I did with the James Bond article, I am going to adjust for inflation by putting everything into 2004 dollars. This will automatically remove the inflation that distorts the comparability of year to year data.
Here's the same data converted into 2004 dollars:

Saw 1 - $55,185,045
Saw 2 - $84,177,916
Saw 3 - $75,707,623
Saw 4 - $58,098,757
Saw 5 - $50,177,182
Saw 6 - $24,585,575

Here it is on a chart:

As you can see, after a sizable jump from the first movie to the second, I think due to the built in publicity of the first film, the box office has declined with each new release. I think this represents the economic principle of diminishing marginal returns, as film viewers get tired of seeing the same thing year after year (in this case, viewers are getting tired of seeing people get tortured by sadistic Rube Goldberg contraptions.)
So what does regression analysis predict for Saw 7? Let's plug in the data and find out.
I will use the same econometric model I used in my earlier Saw article. This model will use only two variables to mathematically predict how Saw 7 will do. The model will be "explaining y in terms of x and z." These explanatory variables are:
1. The numerical order of the release of the films (1,2,3,4,5, and 6)
2. A "sequel dummy" variable (a value of 0 or 1 depending on if the film is the first in the series. So when I plug in the data, Saw 1 will get a 0, and Saw 2 through 6 will each get a 1) This "sequel dummy" isolates the positive effect on the box office that is the result of the built in publicity created by the first film.
And here it goes. Plugging in the data, the statistical software gives me the following function:
Boxoffice[t] = -14471512.3 order[t] +46778902.5 sequeldummy[t] +69656557.3 + e[t]
To translate this statement into English, it says:
The box office of a Saw movie decreases by an average of around $14 million with each new Saw film that is released:
(-14471512.3 order[t])
The box office also increases by around $46 million just from the built in publicity of being part of a franchise, as is the case with Saw 2-6: (46778902.5 sequeldummy[t])And at the end of the function there's: (+69656557.3).
This $69 million figure is the y-intercept, so if you could break the laws of both reality and filmmaking, and release "Saw Zero" this is how much money it would make at the box office (order and sequeldummy would both be 0 in this case leaving just the intercept.)
So what does this mean for Saw 7? Lets plug it in. For Saw 7:
Order = 7
and
Sequeldummy = 1
So our model will be:
BoxOffice(saw 7) = -$14,471,512*(7) + $46,778,902*(1) + $69,656,557
= -$101,300,584 + $46,778,902 + $69,656,557
= $15,134,875 (in 2004 $s)
Adjusting to current dollars, (2009 is the best I can get)
BoxOffice(saw 7) = $17,047,984

So, this model predicts Saw 7 to make around $17,047,984 at the U.S. box office.
To me, this seems like a very low number, if only for one reason:
Saw 7 will be in 3D!
So there are going to be body parts and blood flying at the audience, which will certainly add to its appeal. (Though I'm not much of a fan of the series, I might even see it because it's in 3D.) Adding the 3d-ness of the film into the model would have been tricky, and I prefer to keep this as simple as possible. However I just found a statistic online saying that 3D movies gross on average 4 times as much as 2d movies. If this is true, does it mean that Saw 7 will gross around $70 million dollars? No. Most 3d movies are big budget, family friendly spectacles like Avatar, or the Pixar films, which tend to get higher grosses in the first place. Nonetheless, I would expect Saw 7, just from the fact that it will be in 3 dimensions, to earn more, maybe significantly more, than $17 million. Especially if there is extra blood and guts flying in the audience's face.

Sources:

www.BoxOfficeMojo.com

http://www.westegg.com/inflation/
Wessa, P. (2010), Free Statistics Software, Office for Research Development and Education,
version 1.1.23-r6, URL http://www.wessa.net/
http://www.slideshare.net/DigitalCinemaMedia/2d-vs-3d-box-office

Sunday, July 18, 2010

Free Samples and Diminishing Marginal Utility


Have you ever been at a grocery store and tried a free sample of some food, maybe some potato chips, and thought, "Wow! I could eat a million of these"? You then bought the product, took it home and realized after the second handful of chips that you really didn't want to eat a million of them anymore? If this has happened to you, you've helped to illustrate a very important concept in economics: diminishing marginal utility.
Diminishing marginal utility is the economic and psychological fact that in general, when people consume more of any item (not just food, but other things such as movies as I've explored in earlier articles), their desire to consume more of that item decreases. So one might really enjoy that first potato chip, but after eating a certain number of them, not want to eat any more, even to the point that one might get disgusted by the thought of eating more chips.
There are important biological reasons for human psychology to be this way. If people never got tired of eating potato chips no matter how many they consumed at one time, they would make themselves very sick. The same goes for non-food items, though perhaps to a lesser extent. I'm sure some people out there would be happy with an infinite number of shoes (Imelda Marcos or the Sex and the City girls perhaps?) Nonetheless a certain level of moderation exists in our psychology, and for some very good reasons.
Anyway, the point of my writing this article is to provide a word of advice to consumers: Know your own utility function.
For those who don't know what a utility function is, it's a mathematical or graphical representation of how much satisfaction one gets from consuming more of an item. Though I won't get into the tricky situation of trying to quantify utility, which is an abstract, personal and subjective thing, it is clear that utility diminishes with more units consumed. To make the right purchases for themselves, consumers should realize that the free sample they taste is unique. The next unit of the product will not taste the same, because utility is diminishing with every unit.
But the grocery store doesn't want you to be aware of this. The grocery store wants you to think that every potato chip will be as good as that first one, and that when making your purchase, you will think that your utility function will not decrease, as in this utility function graph:


If one's utility function were like this, every potato chip would be just as good as that first one. Grocery stores would thrive for a while, but humanity would eat itself into extinction. Thankfully this is not the case. In reality, people's utility functions decrease, like this one:


(Notice that just before 50 chips, utility is actually about to go negative. This means the person would get negative utility from more chips, probably due to physical discomfort. Not good for your stomach.)
So when you're at the grocery store and you try a free sample, remember that those tasty potato chips are hitting your taste buds at the very tippy top of your utility function. It's going to be downhill from there. And though at that moment you might feel like you can eat a million chips, if you bought these million chips, you might end up wasting 999,950 of them.