
The game show "Deal or No Deal" is an econ geek's dream. Not only is it a thrilling spectacle for game show lovers, it is also a laboratory for studying human risk-taking behavior. For those who don't know the rules, on the show there are 26 numbered briefcases, each with a tag inside, showing an amount of money. The amount of money in each case ranges from 1 penny to 1 million dollars. The contestant first chooses one of the cases to take into possession, and then through the rest of the game, eliminates cases from the remaining 25, starting with 6 cases at once, then 5 then 4 then 3 then 2 then 1 at a time until all but the contestant's case is gone. As each case is eliminated, the amount it contains is exposed, thus letting the contestant know what amount is not in her own case. If the contestant eliminates all of the 25 cases, she walks away with the amount of money in the initially chosen case. The twist is that there is a "banker" on the show who after each round of elimination, offers the contestant an amount of money to stop playing. Because, superstitions aside, the choice of eliminating one numbered case over another does not matter, the only pertinent decision in the game is whether to take the deal or keep playing, (which makes the title of the show particularly fitting).
As the contestant continues to eliminate from the 25 cases, by inference, she gets a better idea of what is in her own case, and so does the banker. So if the contestant eliminates the case that has the penny, that's a good thing, because it means that the personal case doesn't contain the penny. If the contestant eliminates the million dollars, she knows that her personal case doesn't contain the million, and this is a bad thing.
For years I have watched this show, and wondered "how does the banker choose the amounts of each offer?" After quantitatively studying this (albeit with a limited sample of 64 offers from 9 complete games) I think I have come close to answering this question.
To understand how the banker makes his offers, there's one key mathematical concept to keep in mind: expected value. Expected value is equal to the sum of the values of all possible outcomes multiplied by their respective probabilities. It is the average amount of money per person that a large group of people would win on this game if they never took deals.
When one starts the game, the dollar values of the cases are as follows:
$0.01, $1, $5, $10, $25, $50, $75, $100, $200, $300, $400, $500, $750, $1000, $5000, $10000, $25000, $50000, $75000, $100000, $200000, $300000, $400000, $500000, $750000, $1000000
And the probabilities of each outcome are equally likely: 1/26= (approximately) 0.03846.
So, the expected value, (in this case also just the average of all values because the probabilities are the same), is equal to:
$0.01/26 + $1/26 + $5/26 + $10/26 + $25/26 + $50/26 + $75/26 + $100/26 + $200/26, +$300/26 + $400/26 + $500/26 + $750/26 + $1000/26 + $5000/26 + $10000/26 + $25000/26 + $50000/26 + $75000/26 + $100000/26 + $200000/26 + $300000/26 + $400000/26 + $500000/26 + $750000/26 + $1000000/26 = $131,477
So, when you start the game, the expected value of your personal case, before any of the remaining cases are eliminated, is $131,477. What if, before you even started playing, the banker offered you $80,000 to not play the game at all? Would you take the deal? On average, taking this deal would get contestants much less than playing through all the way. But for reasons I shall explain later in this article, the banker usually makes offers that, just like this one, are significantly lower than the expected value of the case, and despite the low offers, very few contestants actually play through all the cases.
As one plays the game, and eliminates cases, the expected value of what's in one's personal case changes. Lets say that the contestant has eliminated 24 of the cases, leaving just the personal case and one other case in play, and that the only two possible values remaining are $0.01 and $1,000,000. Because the probability of either outcome is 1/2, the expected value of the contestant's personal case would be equal to:
$0.01/2 + $1,000,000/2 = $500,000
What if at this point in the game, the banker offers a deal for $250,000? Ask yourself: if you had a choice here between choosing your case, which might have a million dollars in it or might have a penny, or taking a deal for $250,000, what would you do?
Personally I would take the $250,000. This illustrates an important concept in economics: risk aversion. I am risk averse in this situation because I would choose a certain reward over an uncertain one, even if the expected value of the reward in the uncertain event is greater than the certain reward.
So in Deal or no Deal, the banker always wants the contestant to take the deal, right? Wrong. If contestants took the first or second deals there wouldn't be much of a show, and the network would need to bring on more contestants, and thus give away more prizes, to fill airtime. On top of this, the show tends to get more interesting as it goes along and people make the riskier decisions. For these two reasons, one related to the costs of broadcasting the show, and the other related to the benefits of having a more interesting show, there is an incentive to make lower offers to the contestants in early rounds to get them to play for longer.
The quality of an offer can actually be quantified. There's a measurement I use to find the quality of a deal relative to what cases are still in play. I call it the "Offer Quality Ratio", and here it is:
offer quality ratio = (offer amount)/(expected value of remaining cases at time of offer)
So lets say there are the following cases left on the board (by the way, this is from an actual episode): $1, $100, $50000, and $100000
and the contestant gets an offer of $27000.
The expected value is = $1/4 + $100/4 + $50000/4 +$100000/4 = $37525.25
So the Offer Quality Ratio = $27000/$37525.25 = 0.7195
In other words, the offer is around 72% of the expected value of playing to the end.
After the challenging task of watching TV for hours, I have collected data on 64 offers from 9 complete Deal or No Deal games. My results show that as contestants play the game, they tend to get rewarded with higher quality deals relative to what cases are still in play. From these 9 games, here are the average Offer Quality Ratios for offers in each round:
First offer: 28.9% of expected value, (Standard Deviation 15.8%)
Second offer: 42.8% of expected value, (Standard Deviation 15.0%)
Third offer: 47.7% of expected value, (Standard Deviation 13.6%)
Fourth offer: 54.8% of expected value, (Standard Deviation 12.2%)
Fifth offer: 65.1% of expected value, (Standard Deviation 17.8%)
Sixth offer: 65.0% of expected value, (Standard Deviation 16.1%)
Seventh offer: 84.0% of expected value, (Standard Deviation 17.3%)
Eighth offer: 90.6% of expected value, (Standard Deviation 18.3%)
Ninth offer: 97.6% of expected value (S. Dev 3% from a limited sample of just two offers)
Though I'm sure this study would benefit from a larger sample size, there are two conclusions I have drawn from it.
First, the quality of deals relative to what is on the board tends to rise as games progress. As you can see, the first offer tends to be incredibly low, and is usually not even worth considering.
Only the most risk averse contestants would take a first offer that's under 30% of expected value. As the game progresses, the managers of the show, weighing the costs of giving a bigger payout against the benefits of a more interesting show and more airtime per contestant, increase the quality of the offers.
Secondly, the standard deviation (the average amount of sample variation above or below the average value of all elements in the sample) of offers is significant, at around 15 to 20 Offer Quality percentage points, and remains rather constant throughout the game. This is either because there is an element of randomness built into the offer-determining formula used on the show, or there are hidden variables determining part of each offer. Maybe contestants are given a psych evaluation before the show that gives insight into their risk profiles? This would help the banker minimize payouts while maximizing the thrill of the show.
So, the moral of the story is, if you are ever on Deal or no Deal, fortune might favor you because of your boldness. Rather, I should say, the "banker" (and by that I mean the managers and producers of the show) might favor you with a good offer because you've made the show more interesting, and thus more profitable.


 As you can see, the supply curve has shifted outwards as technology makes a greater quantity of embarrassing videos available. This increases the quantity viewed from Q1 to Q2, but also decreases the value that people place upon each individual embarrassing videos from P1 to P2. This can be very intuitively understood. If there were suddenly twice as many videos of, say, ballroom dancing accidents, each individual video will be less special to each consumer. There are only so many ballroom dancing accident videos consumers will be able to watch within their schedules. With an increased supply, the level of cultural saturation each individual viral video achieves is nothing like the earlier days of the internet. With an increase in supply, viral videos as a whole become more prevalent, but each individual video becomes less distinctive and culturally valued.
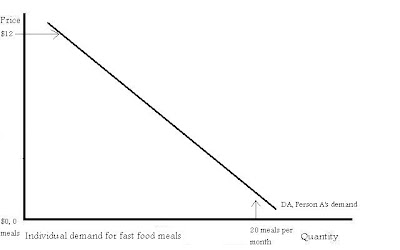
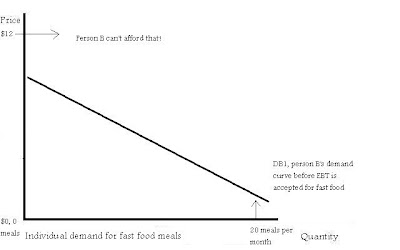
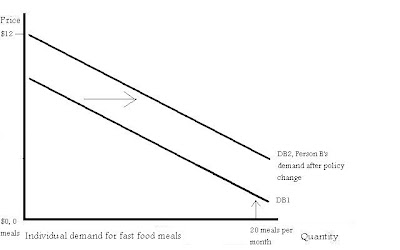
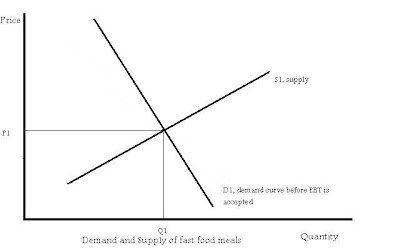 The market price is at P1 and the quantity sold is at Q1. Suddenly the county government for this market allows EBT to be used to buy fast food. What would this do to the demand curve? Because higher income, non-food-stamp recipient customers like person A can affect the entire market demand curve, from the highest prices to the lowest, and lower income food-stamp recipient customers like person B would tend to only affect the lower parts of the demand curve, when EBT is suddenly allowed for fast food purchases, it is only the lower parts of the demand curve that will shift outward (in reality the change would probably not be this prominent but I have made it prominent just for demonstration). Here is the new market demand curve:
 The result is a kink in the demand curve pushing out at the point where most food stamp recipients would be priced out of the market. Assuming the supply curve is below that point, this increases the equilibrium price to P2 and the equilibrium quantity to Q2. Thus this policy is a good thing for fast food companies, increasing their revenue by the amount of:


